- Chart types
- 45+
- Chart types
- Source databases (SQL Server, PostgreSQL, MySQL)
- 3
- Source databases (SQL Server, PostgreSQL, MySQL)
- Ways to deploy — self-hosted or managed
- 2
- Ways to deploy — self-hosted or managed
BI & OLAP Reporting
Self-Serve Dashboards on Your Data
A drag-and-drop OLAP grid and 45+ chart types running directly on your SQL Server, PostgreSQL or MySQL data — no more waiting on IT for the next report.
- Drag & Drop Pivot Grid
- Drill-Down & Drill-Through
- 45+ Chart Types
- Saved Dashboards
- Excel & PDF Export
- White-Label Ready
The Challenge
Your data is ready. Your reporting isn't.
Most businesses have the data they need sitting in SQL Server, PostgreSQL or MySQL — but getting an answer out of it still means:
- Waiting days for IT to build one more report
- Static reports that can't be sliced a different way
- Exporting to Excel just to pivot the data by hand
- No single dashboard view across the business
- Numbers that are stale by the time someone reads them
- Every department running its own spreadsheet of "the truth"
- Rebuilding the same report for every new question
- Reporting locked to whoever wrote the original query
Our Solution
One Live OLAP Grid. Every Question, Answered.
From connecting your database to a shared team dashboard — the whole path is self-serve, no SQL required once a cube is modelled.
The Analyses Engine
Everything a pivot grid needs, and everything a chart needs — in one workspace.
Drag fields onto rows, columns and filters; drill in, calculate, visualize, save, and share — without leaving the browser.
01
Pivot Grid
- Drag dimensions & measures
- Rows, columns & filter shelves
- Swap row/column axes
- Sort & Top-N
02
Drill & Explore
- Drill down / drill up
- Drill-through to row detail
- Breadcrumb trail
- Dimension & measure filters
03
Calculations
- Calculated / derived measures
- Subtotals per level
- Grand totals
- Arithmetic-expression engine
04
Visualize
- 45+ chart types
- World & India maps
- Combo, waterfall, gauge
- Per-chart eligibility rules
05
Dashboards
- Saved answer boards
- Shareable with your team
- Save & reopen reports
- One click back to the grid
06
Export & Share
- Export to Excel
- Export to PDF
- Snapshot PDF mode
- Reusable saved reports
See It Work
Drag a Field. Watch the Grid & Chart Update.
A real recording of the Analyses screen on our AdventureWorks sample cube — drag a dimension onto Rows, a measure onto Measures, and both the pivot grid and the chart refresh instantly.
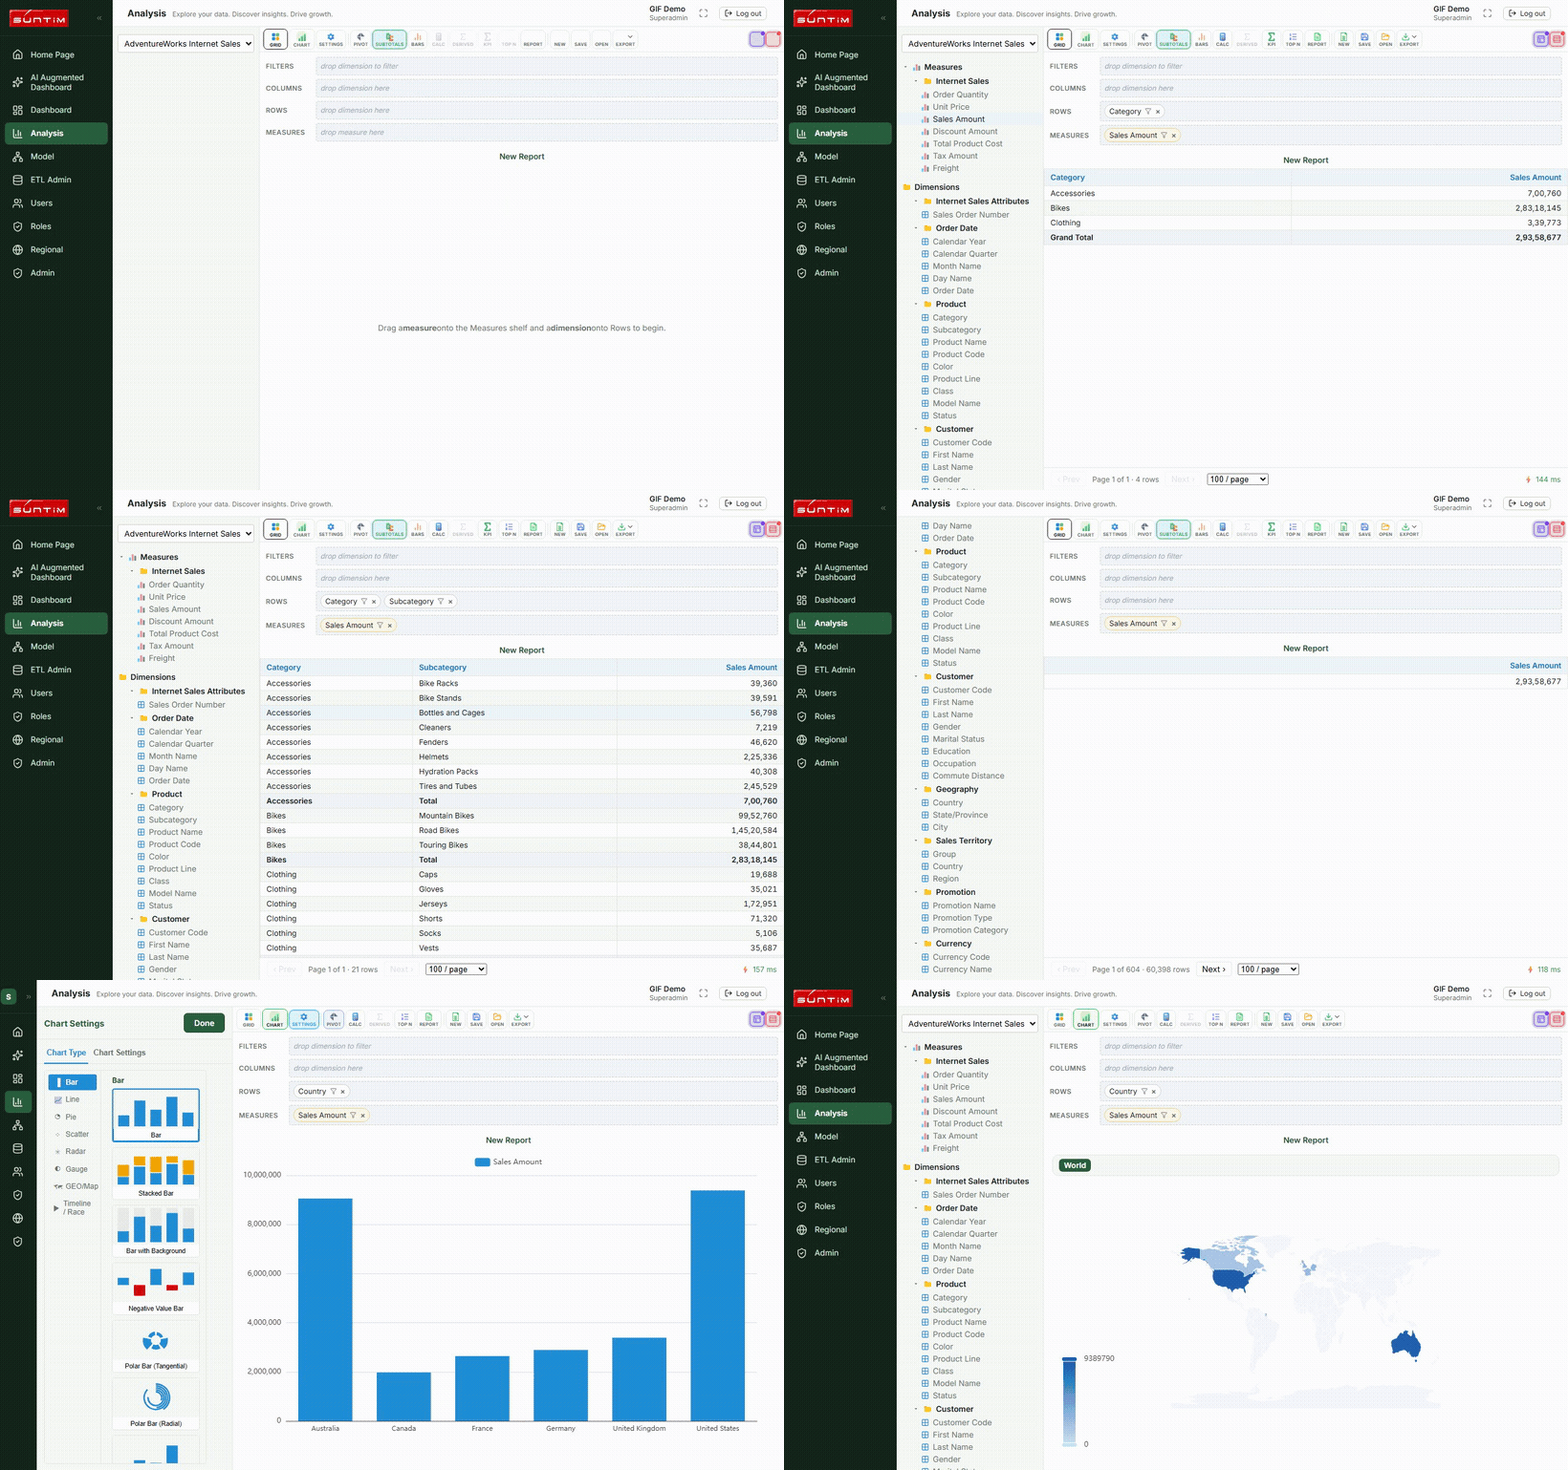
45+ Chart Types, One Click Away
Every chart reads the same cube as the grid — switch between a pivot table and a visual without re-querying anything.
Bar & Column
Stacked, % stacked, polar, waterfall, gradient, combo
Line & Area
Line, area, step, bump charts
Pie & Donut
Pie, doughnut, rose / nightingale
Scatter & Distribution
Scatter, bubble, radar, boxplot, heatmap
Maps
World map and India map with drilldown
Flow & Hierarchy
Sankey, treemap, sunburst, tree, theme river, parallel
Specialty
Funnel, gauge, candlestick, graph/network, Gantt
Race Charts
Animated bar race and line race over time
Works With Your Data
From Any RDBMS to a Fast OLAP Cube
No data export, no manual spreadsheets. Point the ETL at your existing database and it takes the rest from there.
Connect Your RDBMS
Point the ETL at SQL Server, PostgreSQL or MySQL with a connection string — no custom integration code to write.
Auto-Model Your Cubes
A schema analyzer reads your tables and drafts dimensions, measures and relationships automatically — reviewed and refined in a reopenable wizard, not hand-written from scratch.
Incremental & Scheduled Loads
Watermark-based incremental extraction keeps cubes current without a full reload every time — run it as a scheduled job.
Columnar Analytical Engine
Every cube lands in a high-performance columnar OLAP store built for sub-second aggregation across millions of rows — the grid and every chart query it directly.
Deploy It Your Way
Self-Hosted or Managed for You
The same product, two ways to run it — pick whichever fits your IT policy and team size.
Self-Hosted, On Your Infrastructure
Run the full stack — OLAP engine, ETL and web app — on your own servers via Docker, behind your own firewall. Your data never leaves your network.
- You control infra, backups & access
- No data leaves your environment
- Fits regulated / on-prem policies
Managed & Hosted by Us
Don't want to run infrastructure? We host and manage a dedicated instance for you — you get the login, we handle uptime, upgrades and backups.
- No servers for you to manage
- We handle upgrades & backups
- A dedicated instance for your company
Whitelabel
Ship It Under Your Own Brand
If you're a software company, consultancy or systems integrator, deploy BI & OLAP Reporting as your own product — your logo, your name, your client relationship.
- Your company name and logo on the login screen and throughout the app
- Your own color theme instead of the default SunTim palette
- Deployed and licensed per client — not a shared multi-company instance
- Proven pattern: already shipped as separate branded builds for different clients
See It In Action
Your Whole Business, One Grid Away
A pivot grid and a chart, always in sync, always on live data.
- Sales, Finance & Operations in one grid
- Row-level drill-through on any number
- Rollups, subtotals & grand totals
- Save and reopen any analysis
- Dashboards your whole team can open
- Excel & PDF export on demand
Revenue
₹8.4 Cr
+11%Orders
22,180
+6%Margin
34.2%
+2%Active Cubes
6
—Revenue
₹8.4 Cr
One Platform, Full Stack
Everything your reporting needs, under one deployment.
ETL Pipeline
SQL Server, PostgreSQL & MySQL, scheduled or incremental.
OLAP Engine
Columnar store built for fast, large-scale aggregation.
Web App
Grid, charts and dashboards your team opens in a browser.
Your Brand
Whitelabel login, logo and theme on a dedicated instance.
Built By People Who Live In Business Data
SunTim has spent years connecting Tally, ERPs and operational databases to real reporting — BI & OLAP Reporting is that experience, packaged as a product.
Ready to see it on your own data?
Tell us your database and what you want to report on — we'll get back to you within 24 hours.
Talk to Our Experts
Prefer to talk it through first? Reach the team directly — or fill in your requirements alongside and we'll call you back.
Tell Us About Your Reporting Needs
Share your database and what you want to report on — our team will get in touch within 24 hours.